Map page
The map page shows the fields of a selection of farms on a map.
Action bar
The Data product selector shows the active data product. You can change it. This will have an effect on the benchmark data of the fields that are shown.
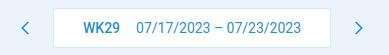
The Period selector shows the current period. Click the "previous" and "next" buttons to change it, or click on the date for a date picker.
The Add new field button opens a dialog that lets you create a new field or import a shapefile.
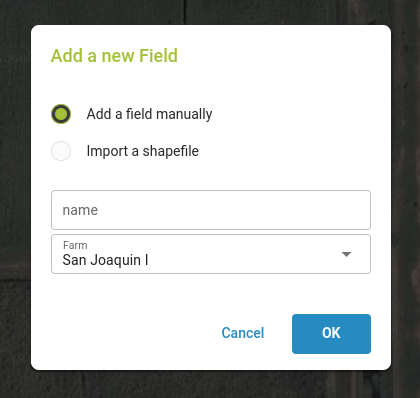
To draw a field manually, enter the name of the field and the farm it will belong to. Afer that you are navigated to the field detail page, where you can enter the shape of the field.
To import fields from a shapefile, click the button "Click to select .zip shapefile". After clicking "OK", the Shapefile import dialog will open up.
The Select farms button opens a dialog where you select a farm group, and within this group, a farm.
If a farm group has multiple farms, you can pick some or all farms. This step is skipped if there's only one farm.
Layer selector
The Layer selector shows the layers that can be displayed on top of the map. There are three basic layers:
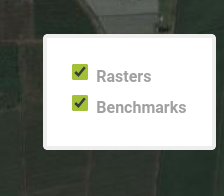
- Rasters: shows raster data pixels on the fields
- Benchmark: shows the field shapes in the colors red, yellow and green. The colors show that a field is doing worse, equally well, or better than the average field.
Legend
The legend shows the meaning of the used colors.
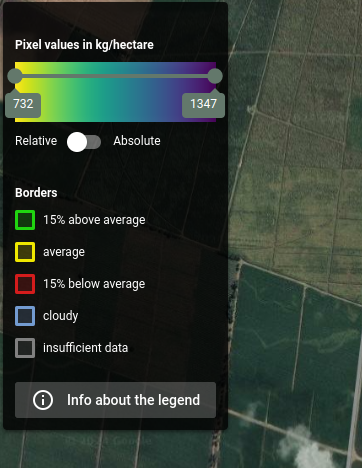
The legend starts with a color ramp that shows the colors used to color the pixels of the selected field. It shows the minimum and maximum values of the pixels in the selected field and how these values correspond to the colors.
Select either "Absolute" or "Relative" to change how the colors are used.
The absolute scale uses a fixed minimum and maximum value that has been predefined for each data product for the the left- and rightmost colors of the scale
The relative scale uses the lowest and highest pixel value of the data product in the field at the selected period for the the left- and rightmost colors of the scale
The next section is about the field border colors.
Green field borders signify that a field perfoms better than average. Yellow and red borders are comparable. A gray border means that there is no data available, or no coverage has been defined and therefore no set of comparable fields can be established.
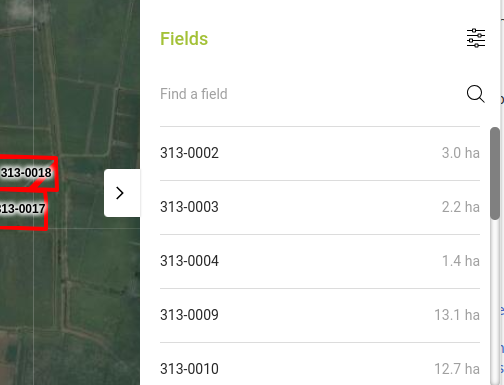
Fields sidebar
The Fields sidebar shows a list of all fields of the selected farms. Clicking on one will show it on the map.
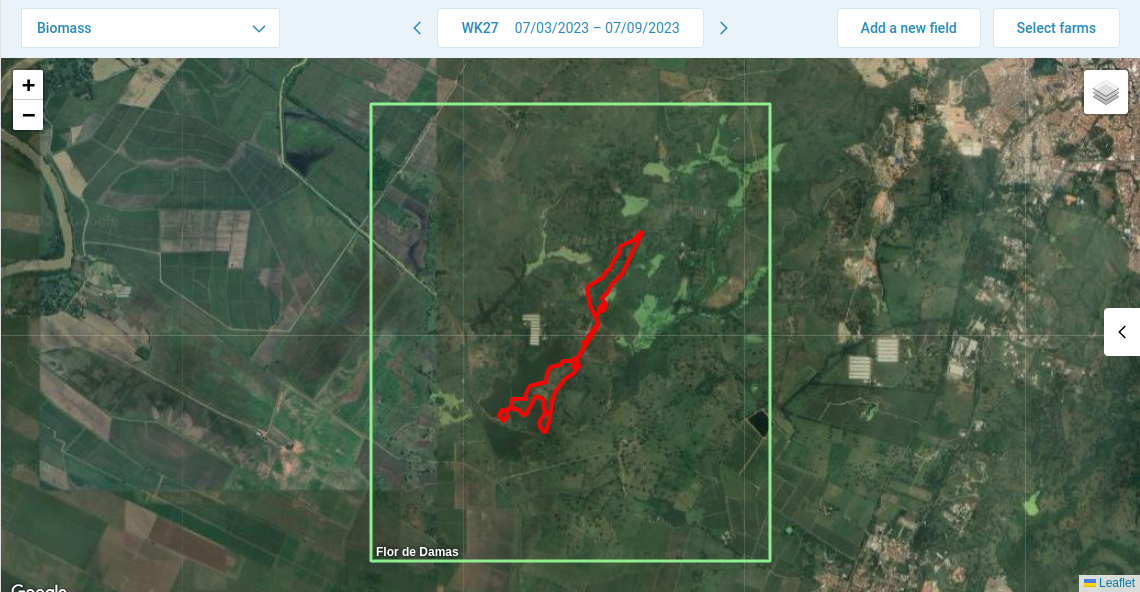
Shapes
On the map itself we see the field shapes that are active in the selected period. When you zoom out you see the bounding boxes of all the fields of a farm (blue rectangle) or farm group (green rectangle).
The field shape is shown differently based on the layers that are active.
If the benchmark layer is active, the border of the shape can have any of these colors:
- red: the value is 15% less than the average value of similar fields (the benchmark)
- yellow: the values is within the 15% band of average values
- green: the value is 15% better than average
- blue: no data is available due to clouds
- grey: no data is available
If one of the raster layer is active, the individual pixels are shown, ranging from yellow (little) to blue (much).
Note: for the data component "Evapotranspiration deficit" lower values are better, and thus the colors red and green are swapped, as well as the colors yellow and blue.
Double-click on a field to go to its detail page directly.
Field details panel
The Field details panel opens when you click on a field.
The Field properties tab shows the fixed properties of the field. Click "Edit properties to change them"
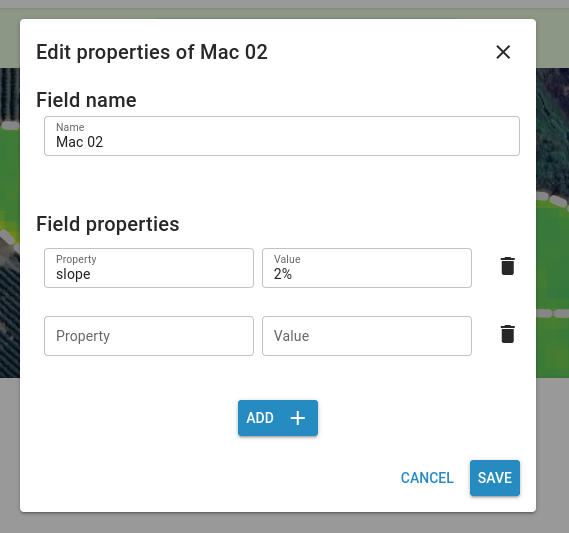
You can also change the name of the field in this dialog.
The Data products tab show the values of all data products

The Growing seasons tab shows all growing seasons of the field. You can change them. Adding or editing a growing season opens the Growing season dialog
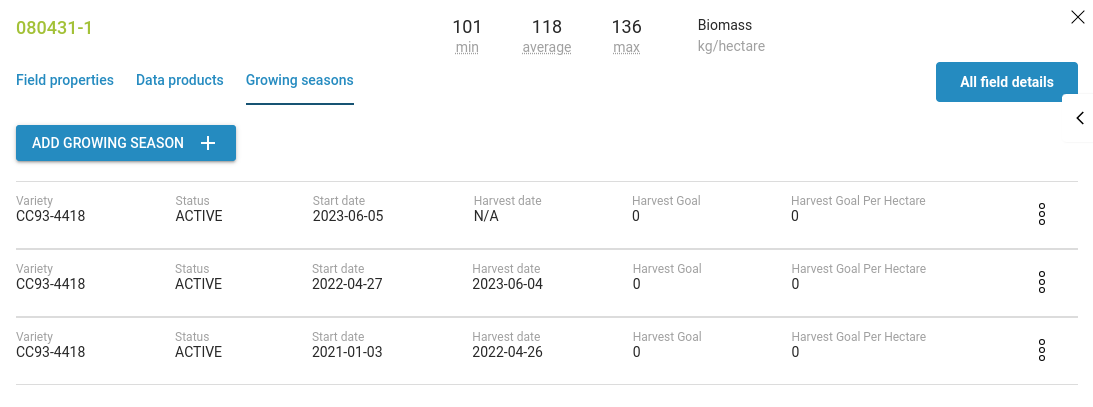
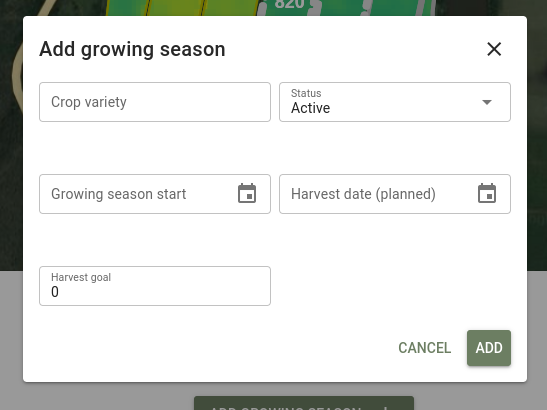
Growing season dialog
The growing season dialog let's you specify what crop (variety) is grown on the field at each period of time. It contains the following elements:
- Variety: select the crop variety
- Status: current state of the growing season calculations.
- Season start date: this date is used as the start of the season by the accumulated data products
- Harvest date (planned): (optional) the date the crop was harvested, or is planned to be harvested
Perennial crops only:
- Plant date: (optional) the date the crop was planted
- Ratoon: (optional) the date the crop was planted
When decision support is enabled:
- Harvest goal: (optional) the goal to strive for this season