Field comparison page
This page compares two or more of the fields that were selected on the Field list page. The page has three tabs: Graph, Spatial views, and Table.
Each tab has a Data product selector. It shows the active data product. You can change it.
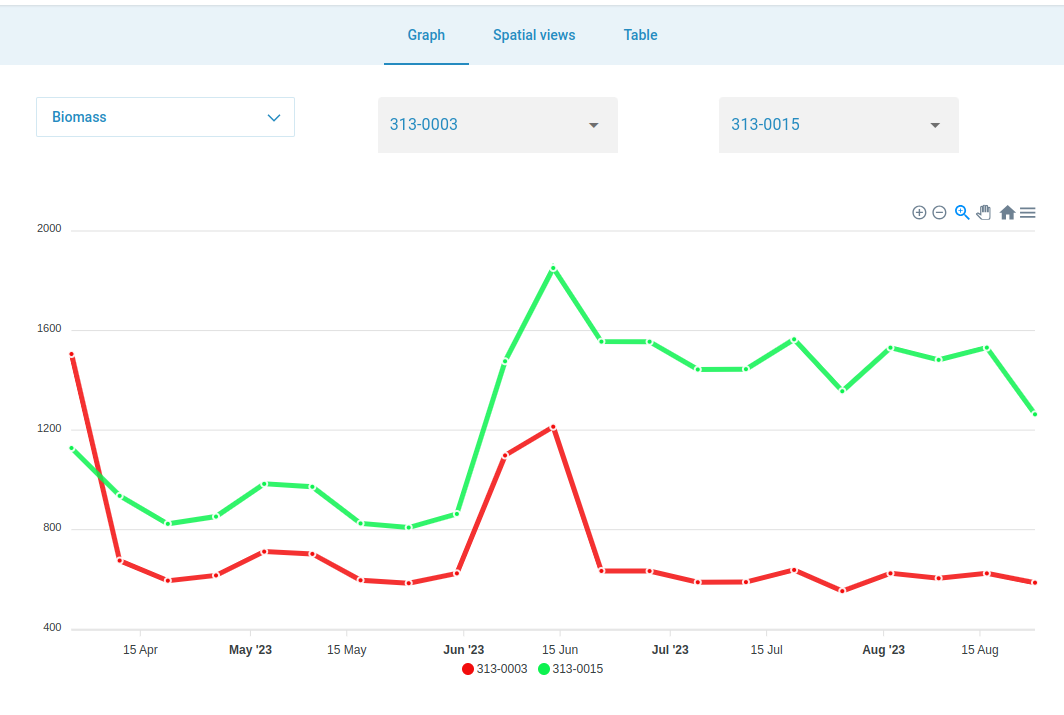
Graph
The graph shows the values of the fields over time. By default it shows the active growing seasons.
Each field has a dropdown that contains all of its growing seasons. Checking these allows you to compare multiple seasons of multiple fields.
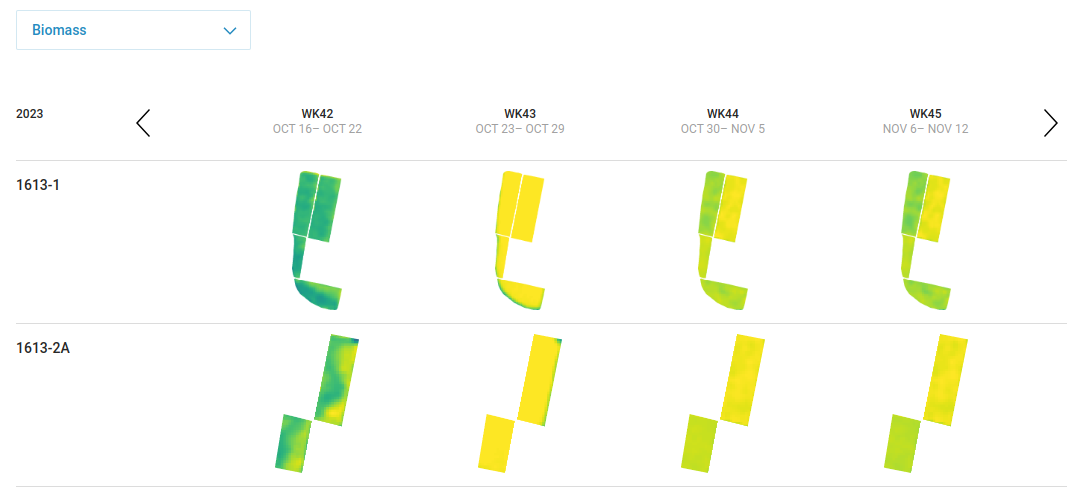
Spatial views
The spatial views is a table that shows field rasters over a period of time for all selected fields, in the specified data product.
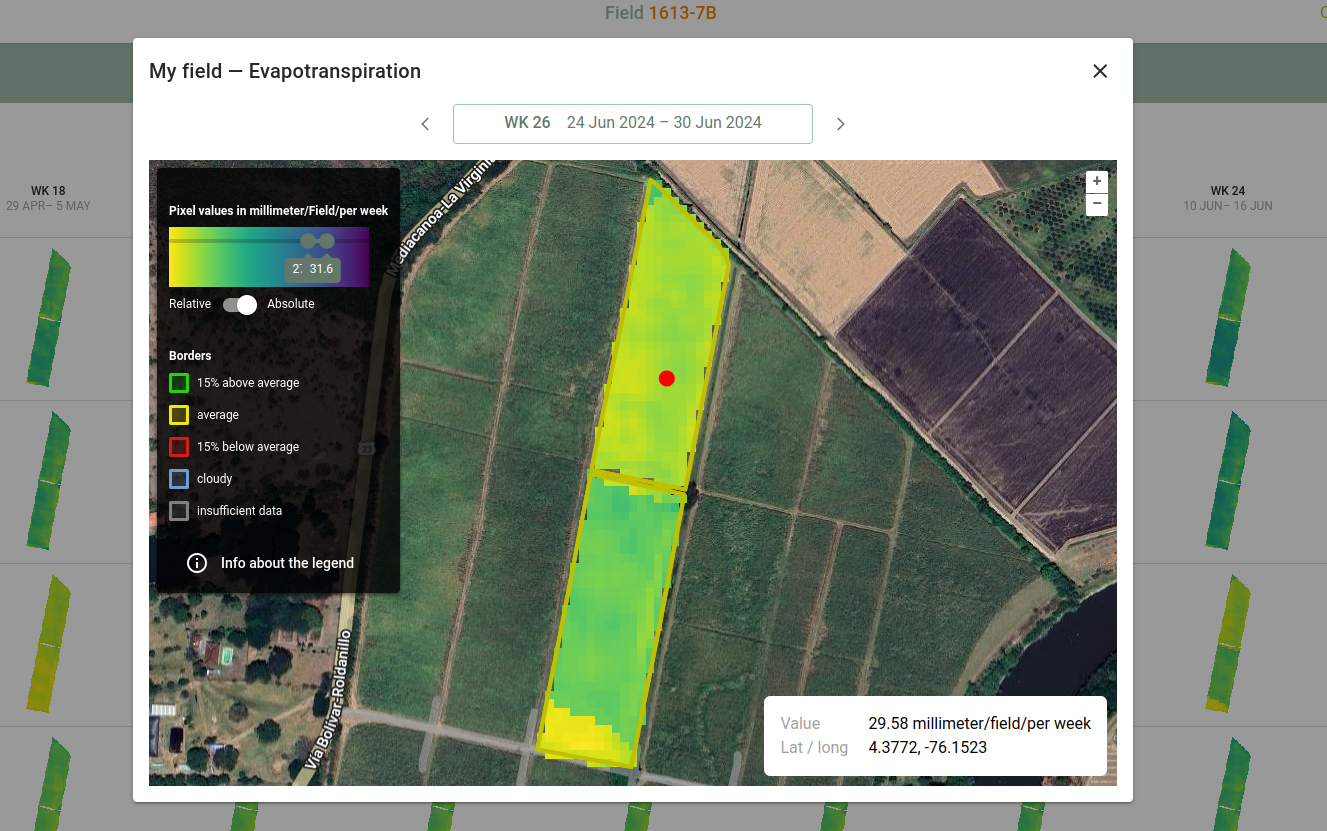
Clicking on a raster opens a dialog with the enlarged raster at that date. If you click on a pixel in the field, the value of that pixel will be shown.
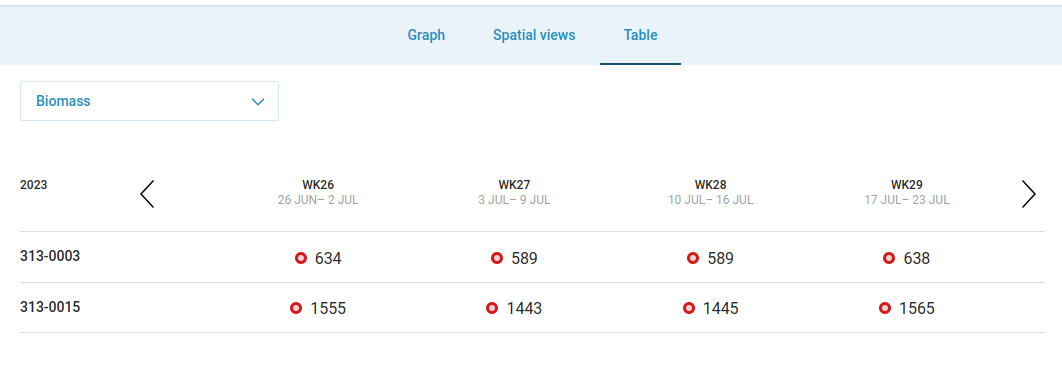
Table
The table shows the mean values as they change over time, for all selected fields. The color or the circle represents the value's position with respect to the benchmark.
By clicking the arrows you go back or forth in time.