Field detail page
This page shows all information available on an individual field. It has several tabs. Each of them shows a different aspect of the field.
Details
This tab shows some main attributes, the shape of the field and the field properties.
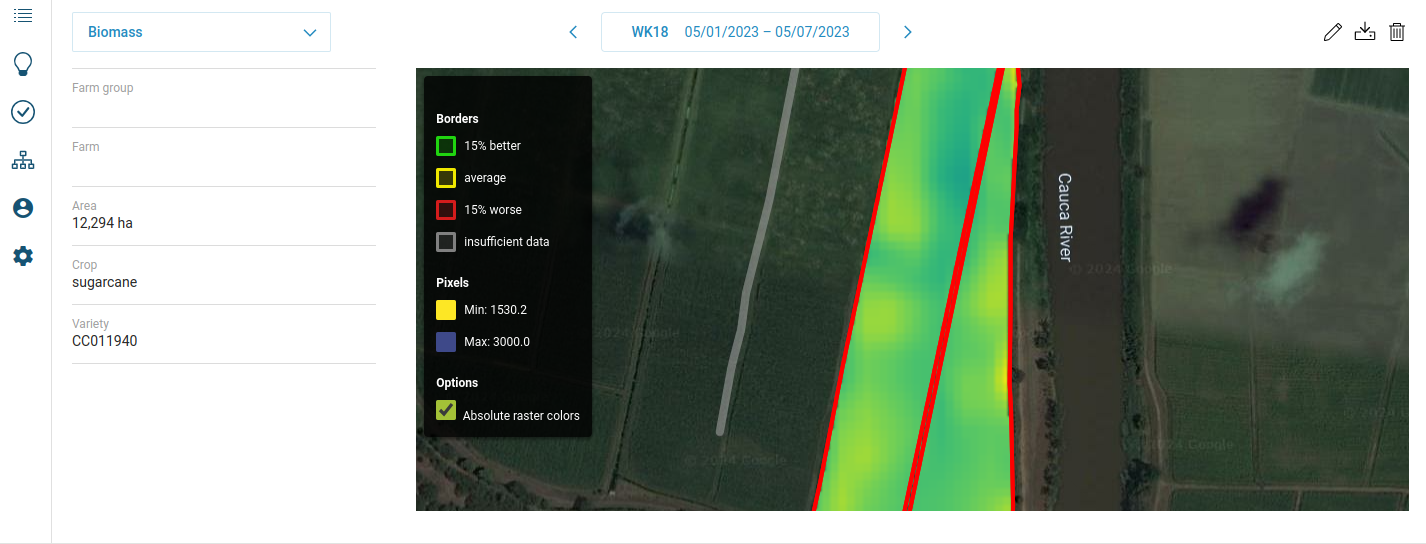
You can change the shape of the field by clicking the pencil icon. This will open the shape editor

By clicking the download button, you get the choice of downloading a TIFF or PNG file.

Clicking the trashcan button will delete the field. A confirmation dialog will appear. Deleting a field is only possible while the field has no data product values.

You can change the growing seasons.
Shape editor
With shape editor you can change the shape of your field. It shows the active field in green and the other near fields in white.
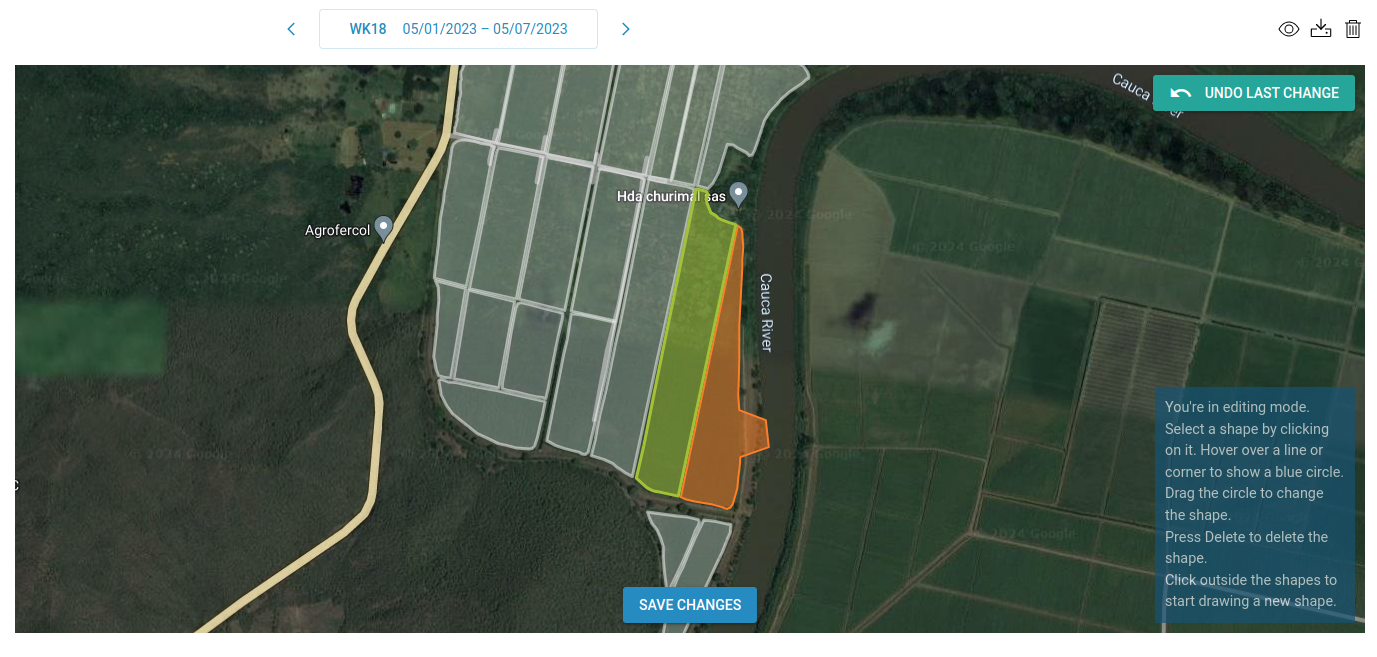
It's important to know that a field's shape can have multiple polygons. Each of them can be changed individually.
The shape editor has two modes: editing mode and drawing mode.
In editing mode you change an existing shape. Select a polygon by clicking on it. Its color changes to orange, and you can drag its borders to a different position. Click outside the polygon to enter drawing mode.
In drawing mode you can draw a new polygon. Click on a position of the map that forms the first corner of the field. Then move to the next corner and click again. Repeat this until you have reached the last corner. Double-click the last corner to complete the polygon. This makes you enter editing mode.
Press the Esc key to enter editing mode.
You can undo any changes you made. If you're satisfied with the shape or shapes you drew, click "Save changes" to store them.
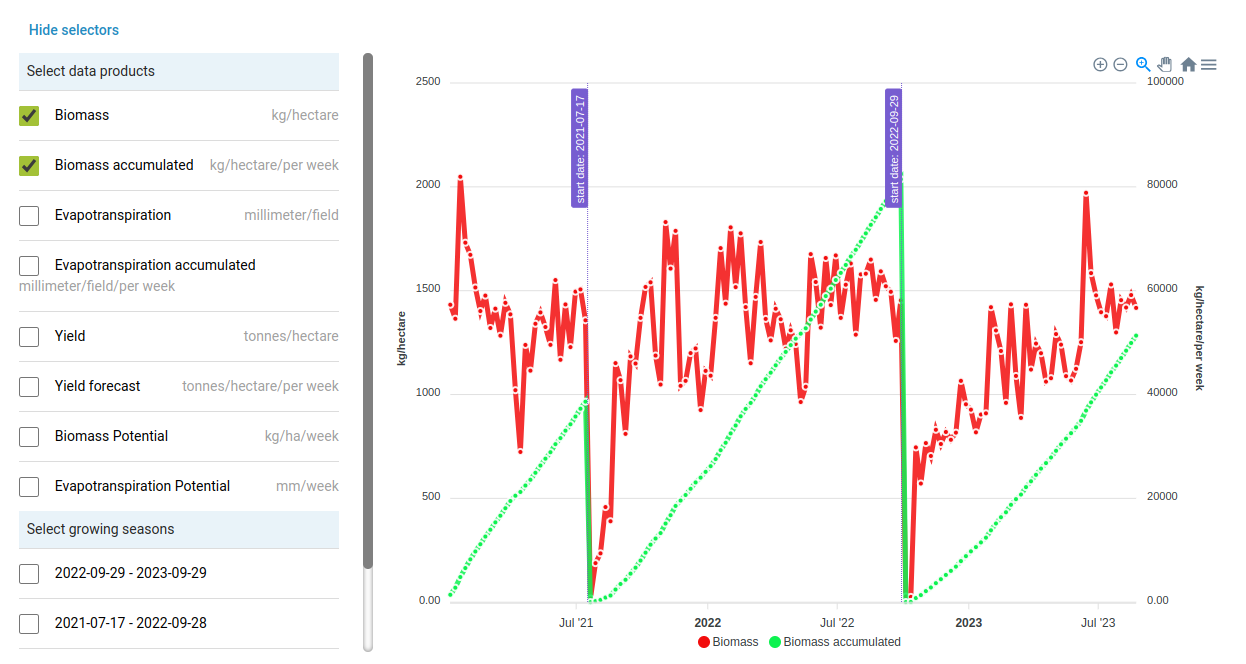
Graph
This tab shows the development of the values of data products over time in a graph. It's possible to select multiple data products in order to compare them. It's also possible to select other growing seasons.
Clicking a point on the graph opens a dialog with the raster at that date.
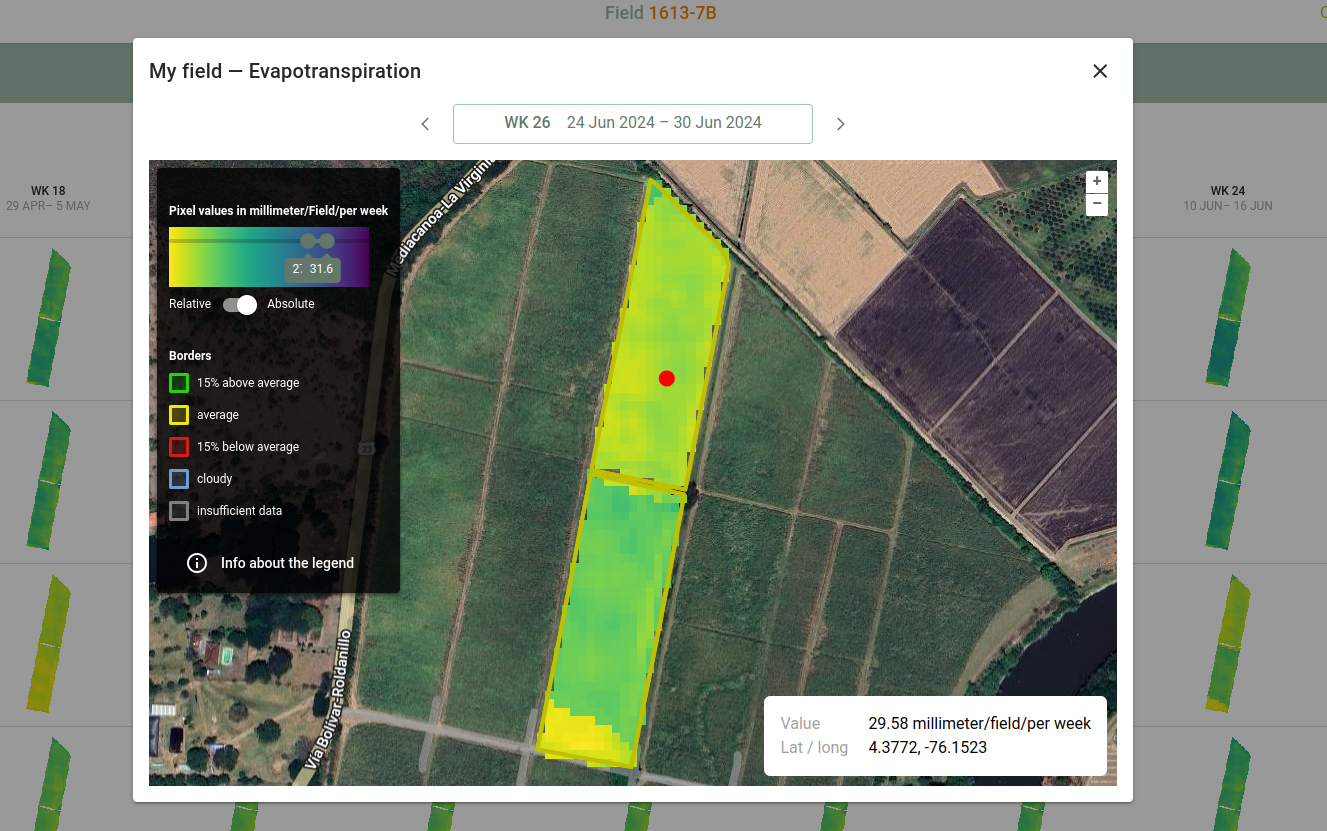
Spatial views
This shows the rasters of the data products of the field over time.
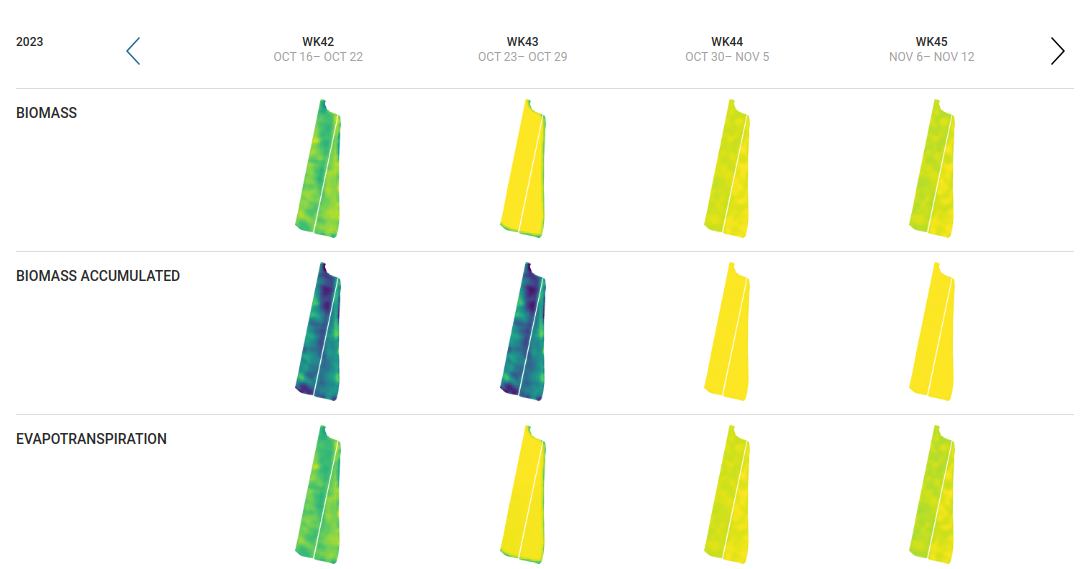
Clicking on a raster opens a dialog with the enlarged raster at that date. If you click on a pixel in the field, the value of that pixel will be shown.
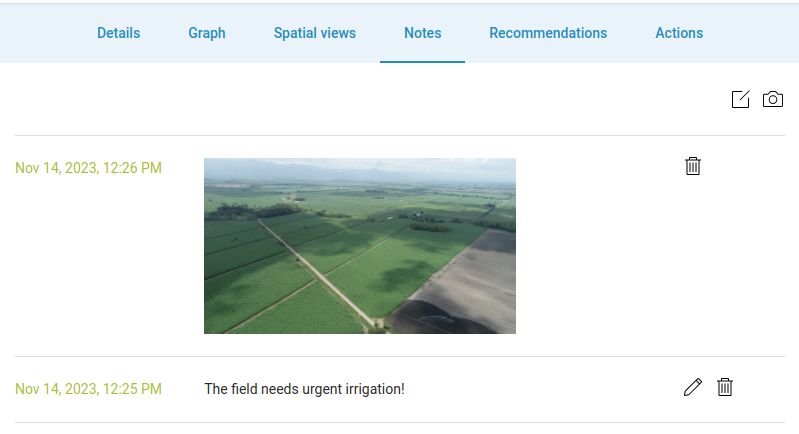
Notes
This tab allows you to add notes to the field, and add photos to it.
Alerts
This page may not be enabled on your system.
This shows the field alerts that were generated for the field.
You can generate alerts for the field manually by clicking "Generate alert". Once a alert has been generated for a rule, it will not be generated again, not even after the rule has been changed.
You can also create actions for field alerts here.
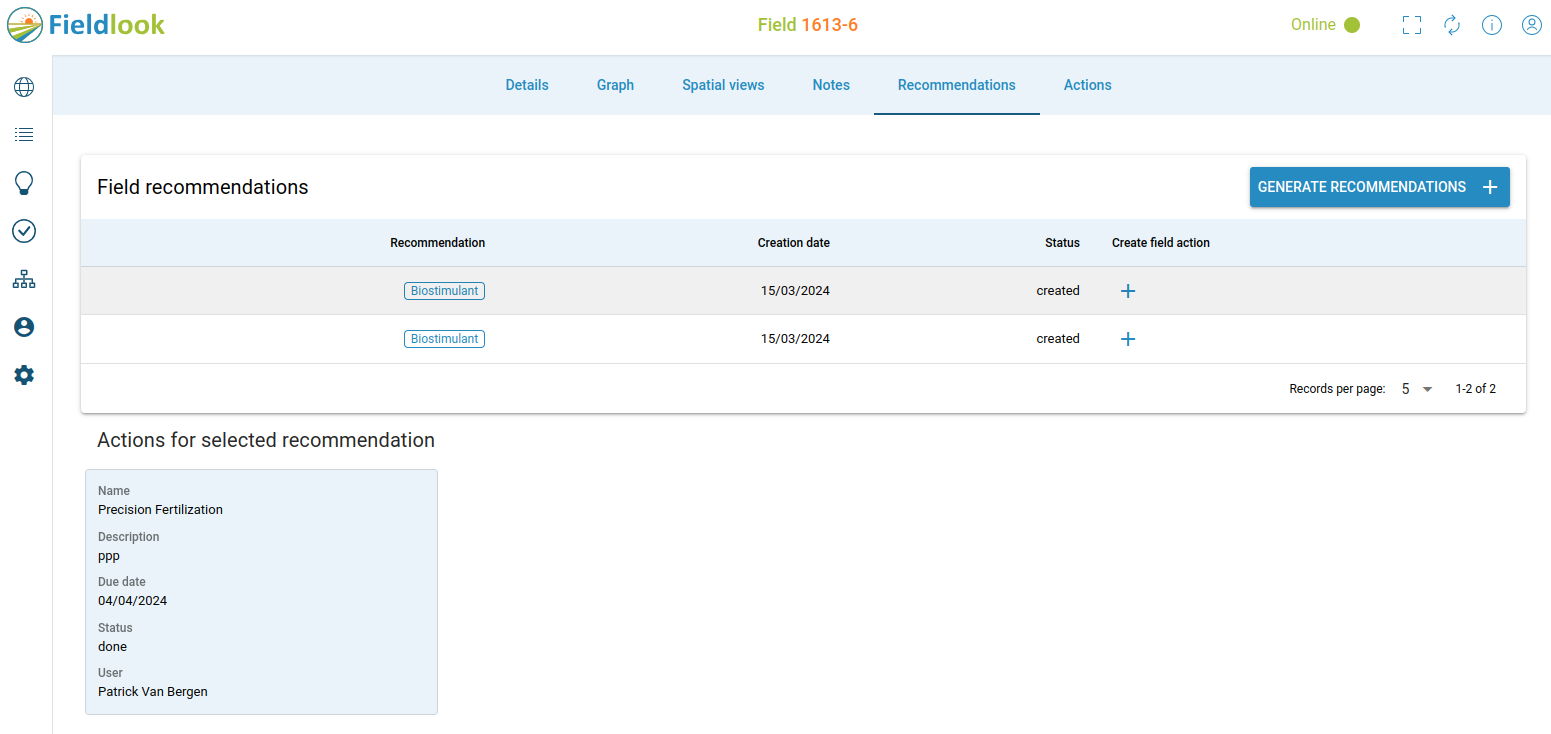
Actions
This page may not be enabled on your system.
This shows the actions that were proposed for the field. You can also create an action here without a alert.
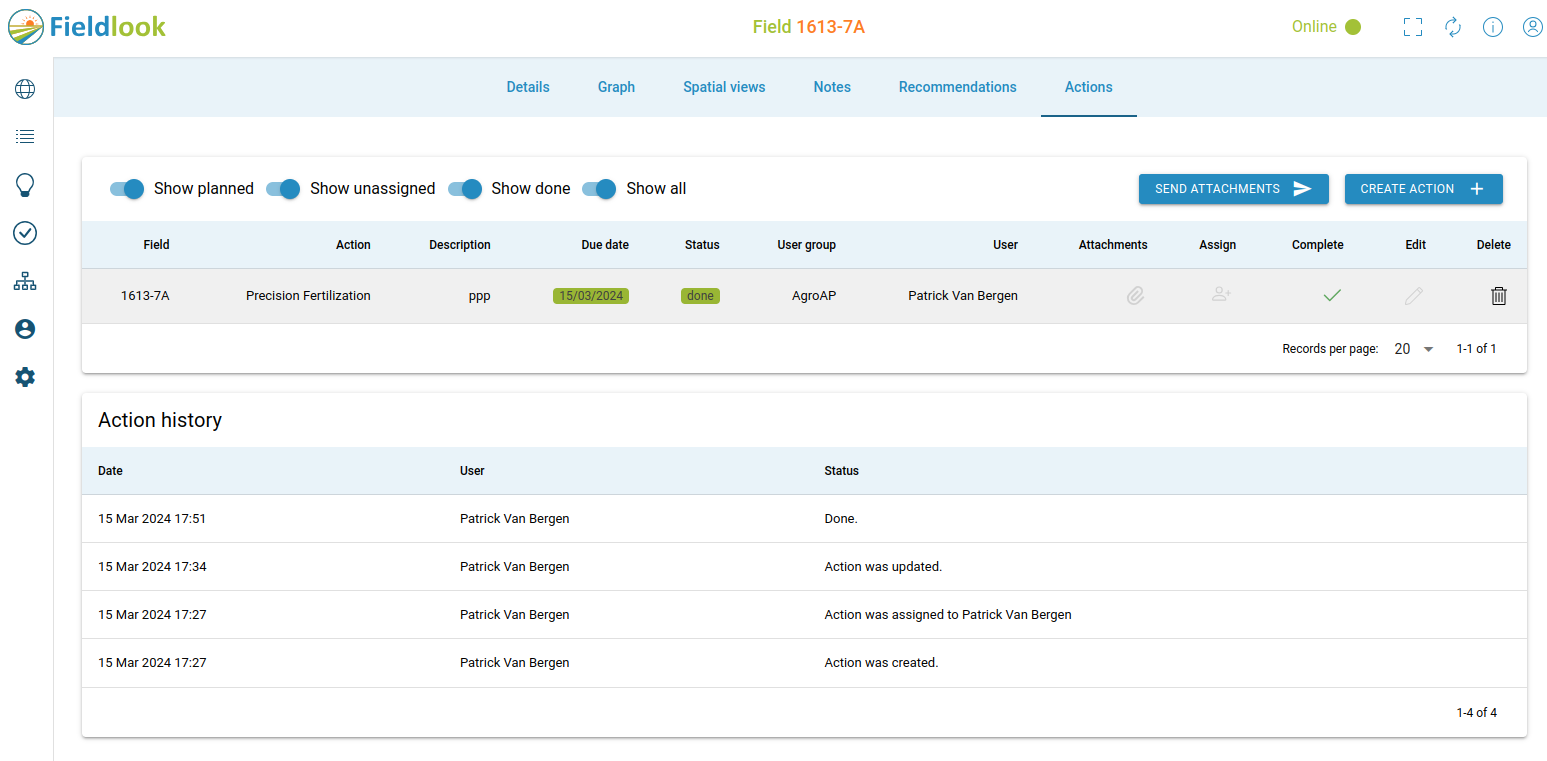
You can edit an action and add an attachment (image or document) to it. When the action is edited a new WhatsApp message is sent to the field worker. By clicking "Send attachments" you can send the attachments to the field worker (via WhatsApp).
By clicking a field action you can see its history and check for any problems, if needed.